A browser-native exploration of maritime and coastal geography. Land, coast and
seabed come from published data — measured bathymetry, vector coastlines, offshore
infrastructure at its real coordinates — and are streamed into a procedural Three.js
scene you can fly through, with every layer declaring where it came from.
Nothing is pre-baked. Ask for a place and the explorer fetches the geography for it —
shorelines, terrain, water depth — and assembles a 20 km² square around that
coordinate, preparing the adjoining ring before you move so the horizon does not pop
in. The ocean is simulated: four-layer waves, transparent shallows, breaking foam,
weather. The seabed beneath it, and the objects standing on it, are the part that has
to be true. This page is explicit about which is which.
The problem
Maritime work is communicated with maps built for specialists, on machines and
licences most of the room does not have.
A coastal or offshore project has to be explained to people who are not hydrographers:
planners, the public, a review panel, a client. The usual answer is a screenshot in a
slide deck or a technical chart nobody outside the discipline can read. Meanwhile the
data behind it carries licences, datums and survey conditions that must not be lost in
the telling. The explorer exists to close that gap without pretending the data is
better than it is.
Access & sharing
Explore maritime and coastal geography with nothing to install.
Put a whole room on the same site instead of a screenshot in a slide deck.
Run on heterogeneous hardware: WebGPU where a dedicated GPU is present, WebGL2 otherwise, showing which backend is active and at what speed, in real time.
Work on ordinary laptops and phones.
Understanding space
Land, coast and seabed in one continuous model.
3D submarine relief from measured bathymetry (EMODnet) in European seas.
Offshore infrastructure — wind farms, platforms, subsea installations, buoys, terminals — at published positions over real seabed.
Onshore and offshore energy infrastructure, including the worldwide WRI wind-site catalogue.
Navigate to any place on Earth by name.
Situate rivers, lakes and coastlines in worldwide terrain context.
Trust in the data
Source, source identifier, status and measured-versus-illustrative provenance, on click.
Distinguish measured from synthetic: un-surveyed cells and synthetic terrain are labelled, and illustrative 3D models are declared as such.
Never mix vertical datums: LAT, ZH and mean sea level stay as declared.
Use differently-licensed data without ambiguity: licence, commercial use, coverage and purpose stated before activation.
Work with restricted surveys without handing them to third parties: GRIDMAR/IH files are imported locally, stay in the browser, and are never uploaded.
Communication
Explain a maritime project to non-specialists with an understandable visual rather than a technical map.
Tidal inletThe Douro estuary at Foz, where the river meets the Atlantic — sand banks and channels from published bathymetry.Norway fjordsSteep terrain, deep water and a shoreline that has to be right.High reliefTerrain data at altitude, with the snow line handled by the lighting model.Tropical shelfA shallow coral shelf fades from turquoise to deep blue.
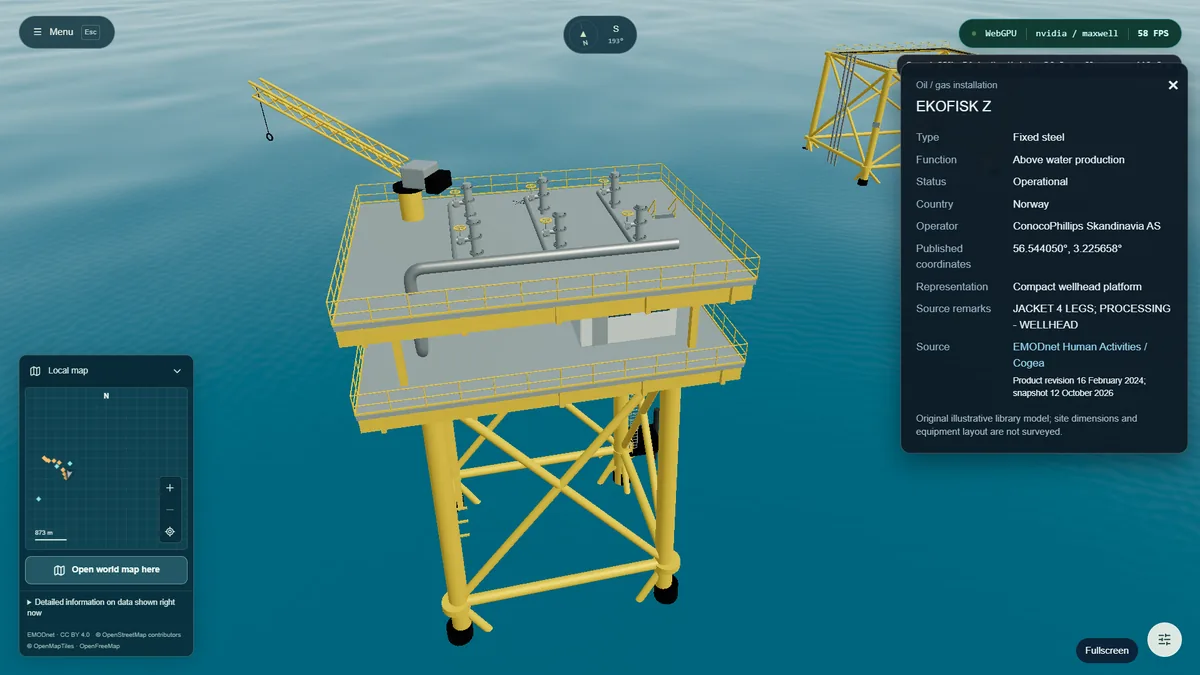
Substance buoyModelled and textured in the in-app asset showroom.Offshore turbineTower, nacelle and blades, built to instance across a wind farm.Asset libraryA shared catalogue: platforms, turbines, buoys, cable and containers.Jacket platformStructural detail preserved down to the bracing, at real scale offshore.Platform in contextThe same asset placed in the sea, lit by the scene sun.
Wind catalogueSearch, scan a region, or find the nearest listed parks to a coordinate.Weather & time of daySunset lighting, sea state and cloud cover, all adjustable live.Quality presetsWater quality and pixel density traded against frame time.Navigation & compassCompass, collapsible local map, and a globe that keeps your position.Geographic launchPick anywhere on the globe; the adjoining tile ring compiles before you move.
How it is built
Engine & renderingThree.js. WebGPU preferred, with an automatic WebGL2 fallback, exposing the active backend, GPU vendor and architecture, and FPS in the UI. Real-time ocean surface and a surface/underwater transition. Free-flight navigation with telemetry, compass, local minimap and world map.
Geospatial data (streamed)World terrain from Mapzen Terrain Tiles / AWS Open Data (USGS, NASA, NOAA, EU-DEM and other national sources). Coasts, rivers, lakes and detailed maps from OpenStreetMap via OpenMapTiles / OpenFreeMap vector tiles. Place search from komoot Photon. Bathymetry from EMODnet. Infrastructure from EMODnet Human Activities plus the bundled WRI worldwide wind catalogue. Global base from Natural Earth (public domain, bundled). Local import of ASCII XYZ and ESRI ASCII grids in EPSG:4326 up to 16 MiB / 2 million samples, entirely in the browser.
3D modelsAll models original. Placed at source-published coordinates with declared illustrative dimensions. Unknown subtypes use labelled markers rather than invented models.
User-centred data governanceThe platform is not a data provider. Per-source activation; a lock until both the platform notice and the provider terms are explicitly accepted; versioned terms with date, time and version, and re-acceptance; immediate revocation including in-flight requests; no account and no server, so the local browser log is erased by clearing storage. A source sheet before activation, permanent attribution, per-object provenance, honesty about gaps, datum integrity. Restricted data stays in memory and disappears on reload.
Data rights vs model rightsThe licence of a dataset and the authorship of a 3D model are separate concerns and are tracked separately, so neither is silently inherited by the other.
What it does not do yet
“Digital twin” is a claim with a definition, and the explorer does not meet it today.
A twin has a temporal dimension: state that changes, indexed in time, that can be
replayed. Until that exists, this is a faithful static view of real data — useful, and
honestly labelled. The rest is direction, not delivery.
The temporal dimension
Trajectories and time-indexed fields with a playback bar — the step that would make “digital twin” an honest description rather than a metaphor.
Review of exercises and trials
Replay a survey or an exercise on the same seabed it happened over.
Scientific model outputs
Load the results a model actually produced, not an illustration of them.
Global bathymetry fallback
GEBCO and equivalents, with the resolution stated wherever they are used.
Owner-permitted data connectors
Client and sensor feeds, activated only with the owner’s permission, never by default.
Offline operation
A field tool that works where there is no network at all.